首页 帮助中心 build-investment-grade-scoring-system-with-make
Mar 3, 2026 | 5 minutes

Cómo construir un sistema de scoring de empresas de grado de inversión con Make y datos alternativos

Descubre cómo usar Make para transformar datos alternativos brutos en un sistema de scoring de empresas estructurado y explicable para inversión, desarrollo corporativo o priorización de go-to-market (GTM). ![Guest post Predictleads](__CODE_BLOCK_0__ Most company scoring systems rely on static firmographic data or non-transparent machine-learning models. The result is either outdated insights or scores that are impossible to explain. But what if you could build a time-aware, explainable company scoring system using real-world signals without writing any code? In this guide, we’ll walk through how to use Make and alternative data to build an investment-grade company scoring workflow using Google Sheets as the output layer.

Why alternative data matters for company scoring

Traditional datasets answer questions like: * How big is the company? * Where is it located? * What industry is it in?

Alternative data answers more important questions: * Is the company hiring right now? * Are they investing in leadership and new tools? * Is something changing internally?

By using signals such as job openings , news events , and technology adoption , you can measure momentum instead of static attributes.

Real-world use cases: Who it is for

This type of scoring system can be used for: * Investment screening * Corp dev target prioritization * Sales and GTM account scoring * Partner evaluation * Market monitoring

What makes a scoring system “investment-grade”

Before building the workflow, let’s define the requirements. An investment-grade scoring system should be: * Time-based - focused on recent activity rather than snapshots * Explainable - every score can be traced back to signals * Composable - signals can be added or removed easily * Automated - no manual updates or scripts

Overview: the Make workflow architecture

At a high level, the scenario looks like this: ![GP_Predictleads_Scenario 2](__CODE_BLOCK_1__ Each company is processed independently, and all signals are written back once per run.

Step 1: Set up your company list in Google Sheets

Create a Google Sheet with one row per company: Example columns: * domain * jobs_90d * jobs_30d * senior_roles_90d * score

![GP_Predictleads_Scenario](__CODE_BLOCK_2__ This sheet will act as both your input and output layer.

Step 2: Create a new Make scenario

1. Log in to your Make account 2. Click Create a new scenario 3. Add Google Sheets → Get rows as the first module 4. Select your company list sheet

Build automations via natural conversation with Maia!

[Read blog](__CODE_BLOCK_3__

Step 3: Iterate through companies

Add: * Tools → Iterator

Map the rows from Google Sheets. From this point on, every step runs once per company domain.

Step 4: Count job openings in the last 90 days

Now let’s add the first and strongest signal: hiring activity.

PredictLeads → List Job Openings

Configure: * Domain = current row domain * first_seen_at_from = now - 90 days

This returns one bundle per job opening.

Tools → Array Aggregator

Collapse all job bundles into a single array. *

Tools → Set variable

Create: jobs_90d = length(aggregated_jobs) Esto te da el número total de nuevas vacantes publicadas en los últimos 90 días. *

Paso 5: Identificar la actividad de contratación de perfiles sénior

La contratación de liderazgo suele indicar crecimiento estratégico.

PredictLeads → List Job Openings (90 days)

Vuelve a usar la misma consulta de 90 días. *

Filter

Conserva solo los roles en los que: * seniority ∈ manager, director, head, VP, executive

*

Array Aggregator + Set variable

Crea: senior_roles_90d = length(aggregated_senior_jobs)

Paso 6: (Opcional) Añadir impulso a corto plazo

Repite el mismo patrón con una ventana de 30 días: jobs_30d = ofertas de empleo detectadas por primera vez en los últimos 30 días Esto te permite medir la aceleración de la contratación.

Paso 7: Actualizar Google Sheets (una sola escritura)

Al final del escenario: Añade Google Sheets → Update row Haz coincidir las filas por: * domain

Actualiza: * jobs_90d * jobs_30d * senior_roles_90d * last_scored_at

Esto garantiza que todas las métricas se registren en la misma fila.

¿Qué ventajas ofrece?

Este enfoque garantiza: * Sin problemas de concurrencia * Sin actualizaciones parciales * Números completamente explicables * Depuración sencilla * Fácil de ampliar

Cada conjunto de datos se procesa de forma independiente, y Make actúa como capa de orquestación.

Ampliar el flujo de trabajo con más señales

Una vez que el bloque de empleos esté estable, puedes añadir fácilmente:

Eventos de noticias

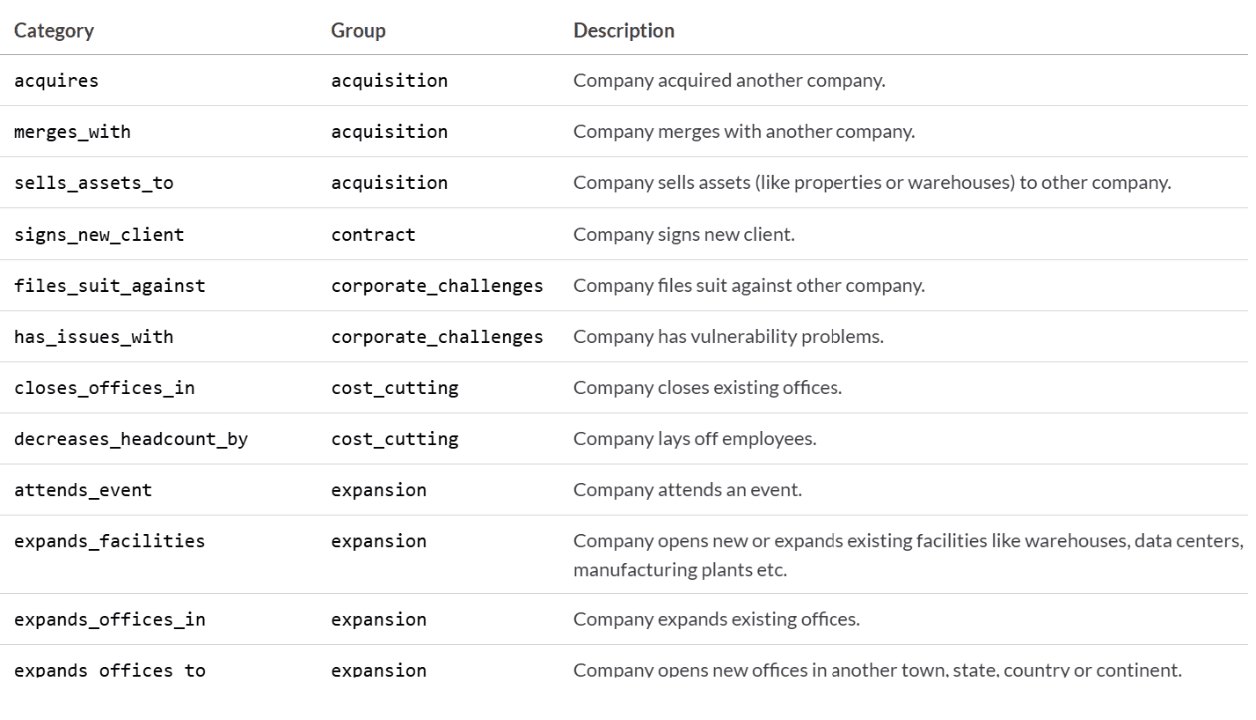
* Contar eventos de alta confianza * Detectar señales negativas como despidos

!GP_PredictLeads_Table 2 Todas las categorías se pueden encontrar aquí.

Adopción de tecnología

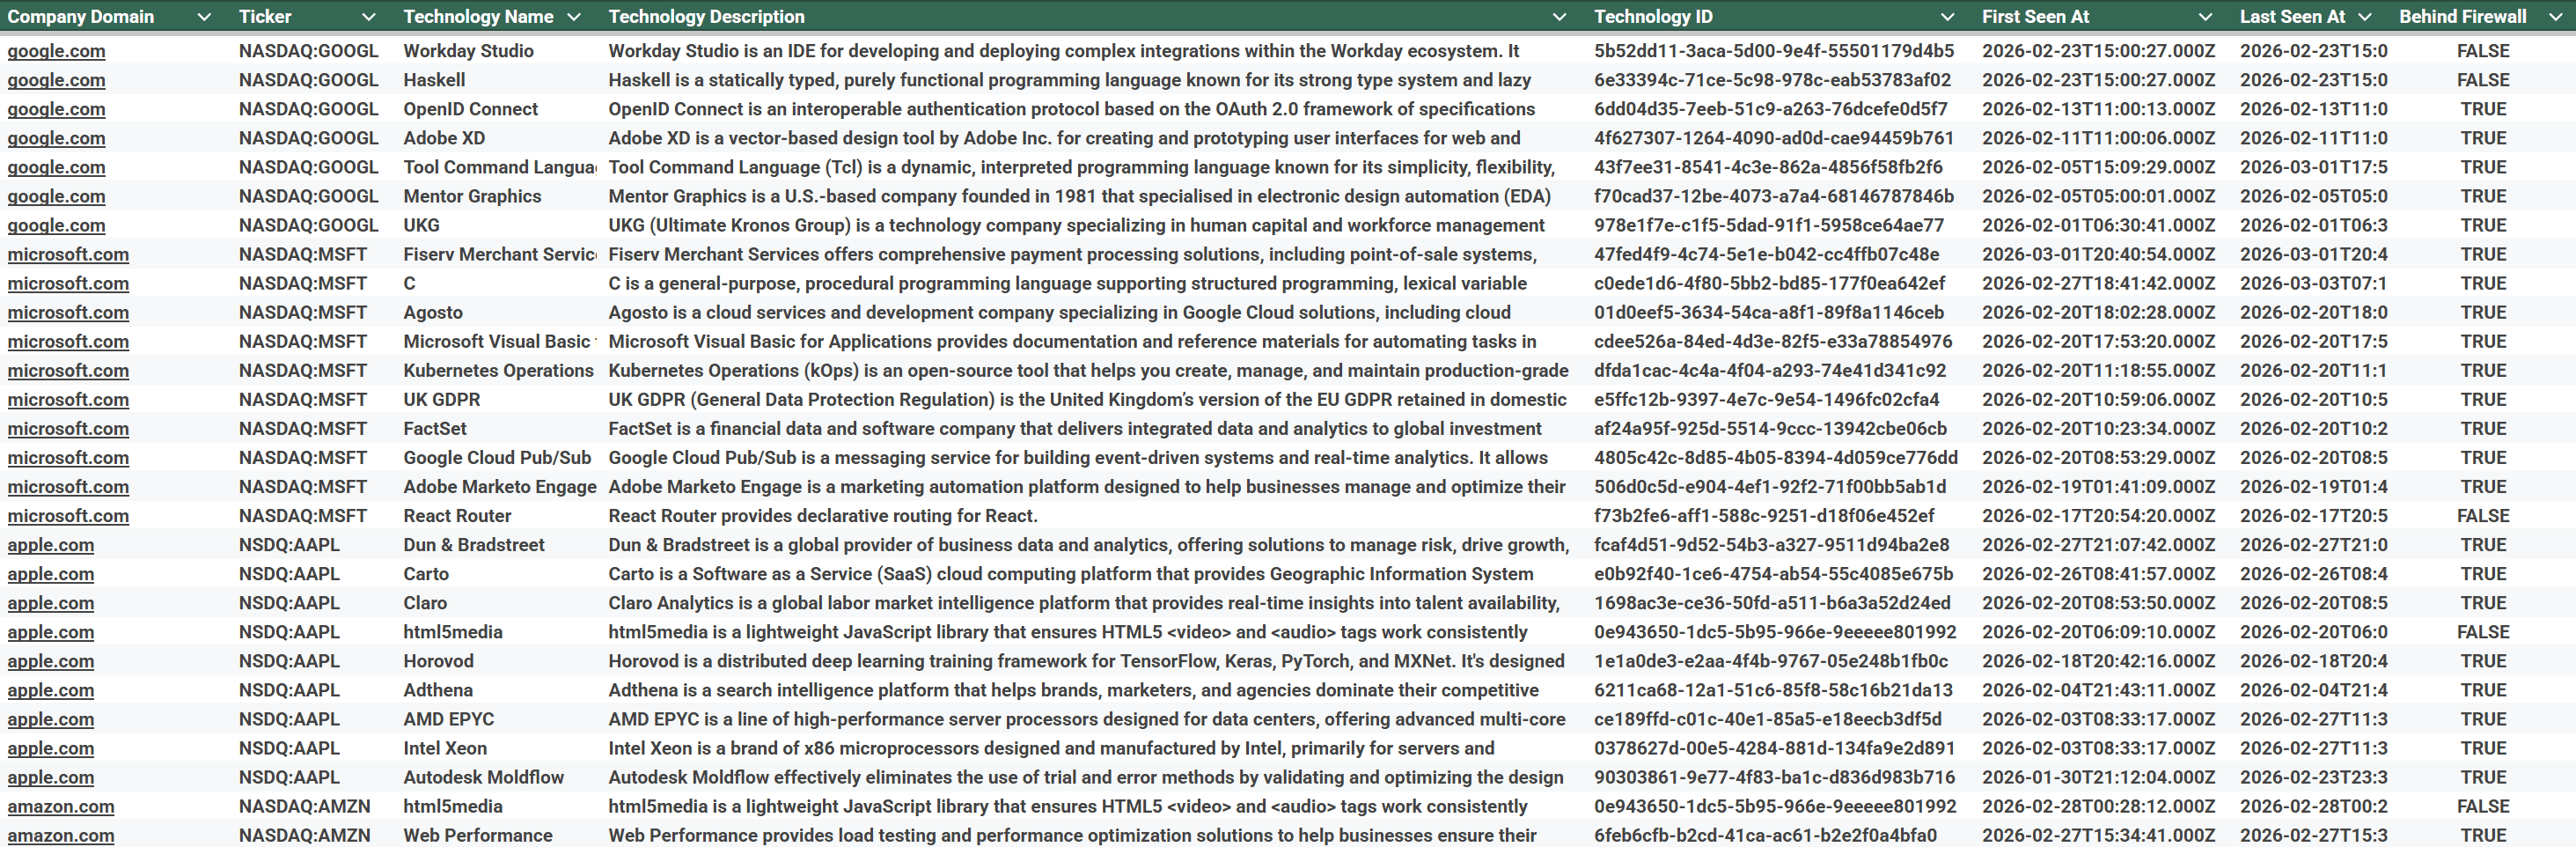
* Medir el uso de una pila tecnológica moderna * Detectar cambios recientes en herramientas

Cada señal sigue el mismo patrón: Fetch → Filter → Aggregate → Variable !Guest post_Predictleads_Table

学以致用,立即上手

读完文档后,不如亲自动手 — 免费注册 Make.com 账户,跟着教程搭建你的第一个工作流

✓ 永久免费版 ✓ 无需信用卡 ✓ 60 秒注册
🚀 免费注册 Make 账户