首页 帮助中心 build-investment-grade-scoring-system-with-make
3 de mar. de 2026 | 5 minutos

Como construir um sistema de score de empresas de nível institucional com Make e dados alternativos

Descubra como usar o Make para transformar dados alternativos brutos em um sistema estruturado e explicável de score de empresas para investimentos, desenvolvimento corporativo ou priorização de go-to-market. ![Guest post Predictleads](__CODE_BLOCK_0__ Most company scoring systems rely on static firmographic data or non-transparent machine-learning models. The result is either outdated insights or scores that are impossible to explain. But what if you could build a time-aware, explainable company scoring system using real-world signals without writing any code? In this guide, we’ll walk through how to use Make and alternative data to build an investment-grade company scoring workflow using Google Sheets as the output layer.

Why alternative data matters for company scoring

Traditional datasets answer questions like: * How big is the company? * Where is it located? * What industry is it in?

Alternative data answers more important questions: * Is the company hiring right now? * Are they investing in leadership and new tools? * Is something changing internally?

By using signals such as job openings , news events , and technology adoption , you can measure momentum instead of static attributes.

Real-world use cases: Who it is for

This type of scoring system can be used for: * Investment screening * Corp dev target prioritization * Sales and GTM account scoring * Partner evaluation * Market monitoring

What makes a scoring system “investment-grade”

Before building the workflow, let’s define the requirements. An investment-grade scoring system should be: * Time-based - focused on recent activity rather than snapshots * Explainable - every score can be traced back to signals * Composable - signals can be added or removed easily * Automated - no manual updates or scripts

Overview: the Make workflow architecture

At a high level, the scenario looks like this: ![GP_Predictleads_Scenario 2](__CODE_BLOCK_1__ Each company is processed independently, and all signals are written back once per run.

Step 1: Set up your company list in Google Sheets

Create a Google Sheet with one row per company: Example columns: * domain * jobs_90d * jobs_30d * senior_roles_90d * score

![GP_Predictleads_Scenario](__CODE_BLOCK_2__ This sheet will act as both your input and output layer.

Step 2: Create a new Make scenario

1. Log in to your Make account 2. Click Create a new scenario 3. Add Google Sheets → Get rows as the first module 4. Select your company list sheet

Build automations via natural conversation with Maia!

[Read blog](__CODE_BLOCK_3__

Step 3: Iterate through companies

Add: * Tools → Iterator

Map the rows from Google Sheets. From this point on, every step runs once per company domain.

Step 4: Count job openings in the last 90 days

Now let’s add the first and strongest signal: hiring activity.

PredictLeads → List Job Openings

Configure: * Domain = current row domain * first_seen_at_from = now - 90 days

This returns one bundle per job opening.

Tools → Array Aggregator

Collapse all job bundles into a single array. *

Tools → Set variable

Create: jobs_90d = length(aggregated_jobs) Isso fornece o número total de novas vagas abertas nos últimos 90 dias. *

Etapa 5: Identificar atividade de contratação de liderança

Contratações de liderança muitas vezes sinalizam crescimento estratégico.

PredictLeads → List Job Openings (90 days)

Reutilize a mesma consulta de 90 dias. *

Filter

Mantenha apenas cargos em que: * seniority ∈ manager, director, head, VP, executive

*

Array Aggregator + Set variable

Crie: senior_roles_90d = length(aggregated_senior_jobs)

Etapa 6: (Opcional) Adicionar impulso de curto prazo

Repita o mesmo padrão com uma janela de 30 dias : jobs_30d = vagas abertas vistas pela primeira vez nos últimos 30 dias Isso permite medir a aceleração da contratação.

Etapa 7: Atualizar o Google Sheets (uma única gravação)

No final do cenário: Adicione Google Sheets → Update row e faça a correspondência das linhas por: * domain

Atualize: * jobs_90d * jobs_30d * senior_roles_90d * last_scored_at

Isso garante que todas as métricas sejam gravadas na mesma linha.

O que isso lhe dá

Esta abordagem garante: * Sem race conditions * Sem atualizações parciais * Resultados totalmente explicáveis * Fácil de depurar * Fácil de expandir

Cada dataset é processado de forma independente, e o Make atua como camada de orquestração.

Expandindo o fluxo de trabalho com mais sinais

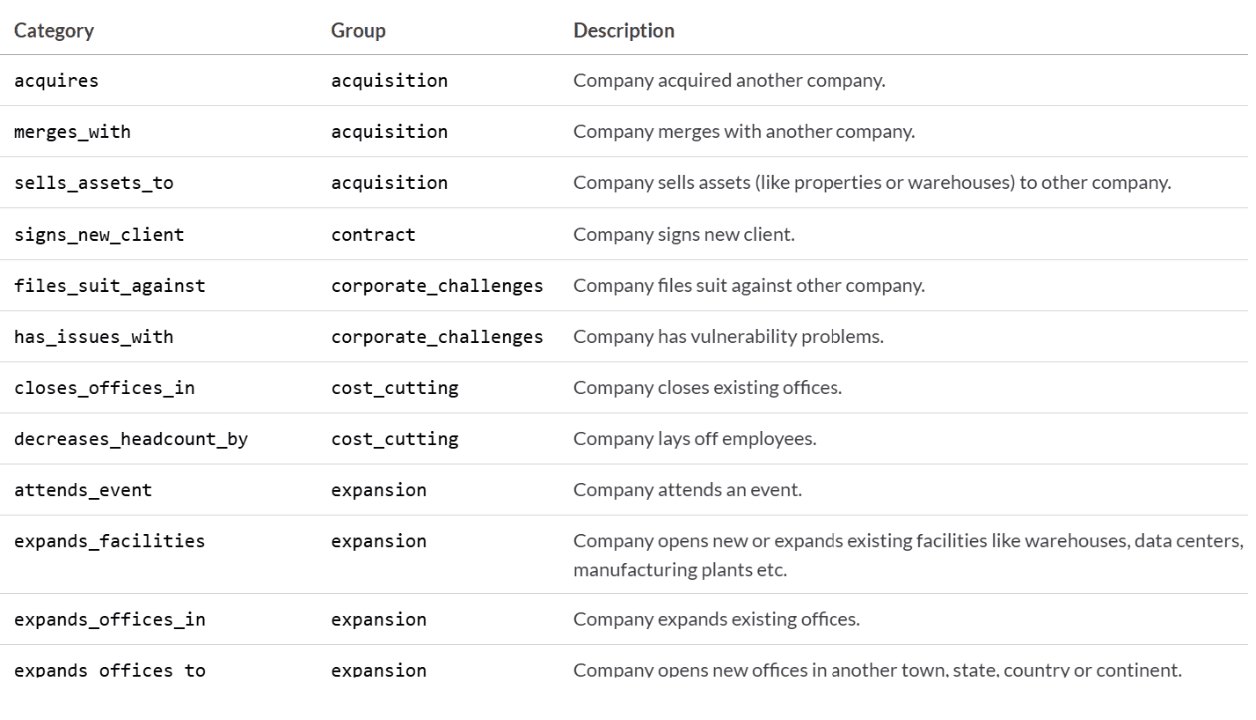
Assim que o bloco de vagas estiver estável, você pode adicionar facilmente:

Eventos de notícias

* Contabilizar eventos com alta confiabilidade * Detectar sinais negativos como demissões

!GP_PredictLeads_Table 2 Todas as categorias podem ser encontradas aqui.

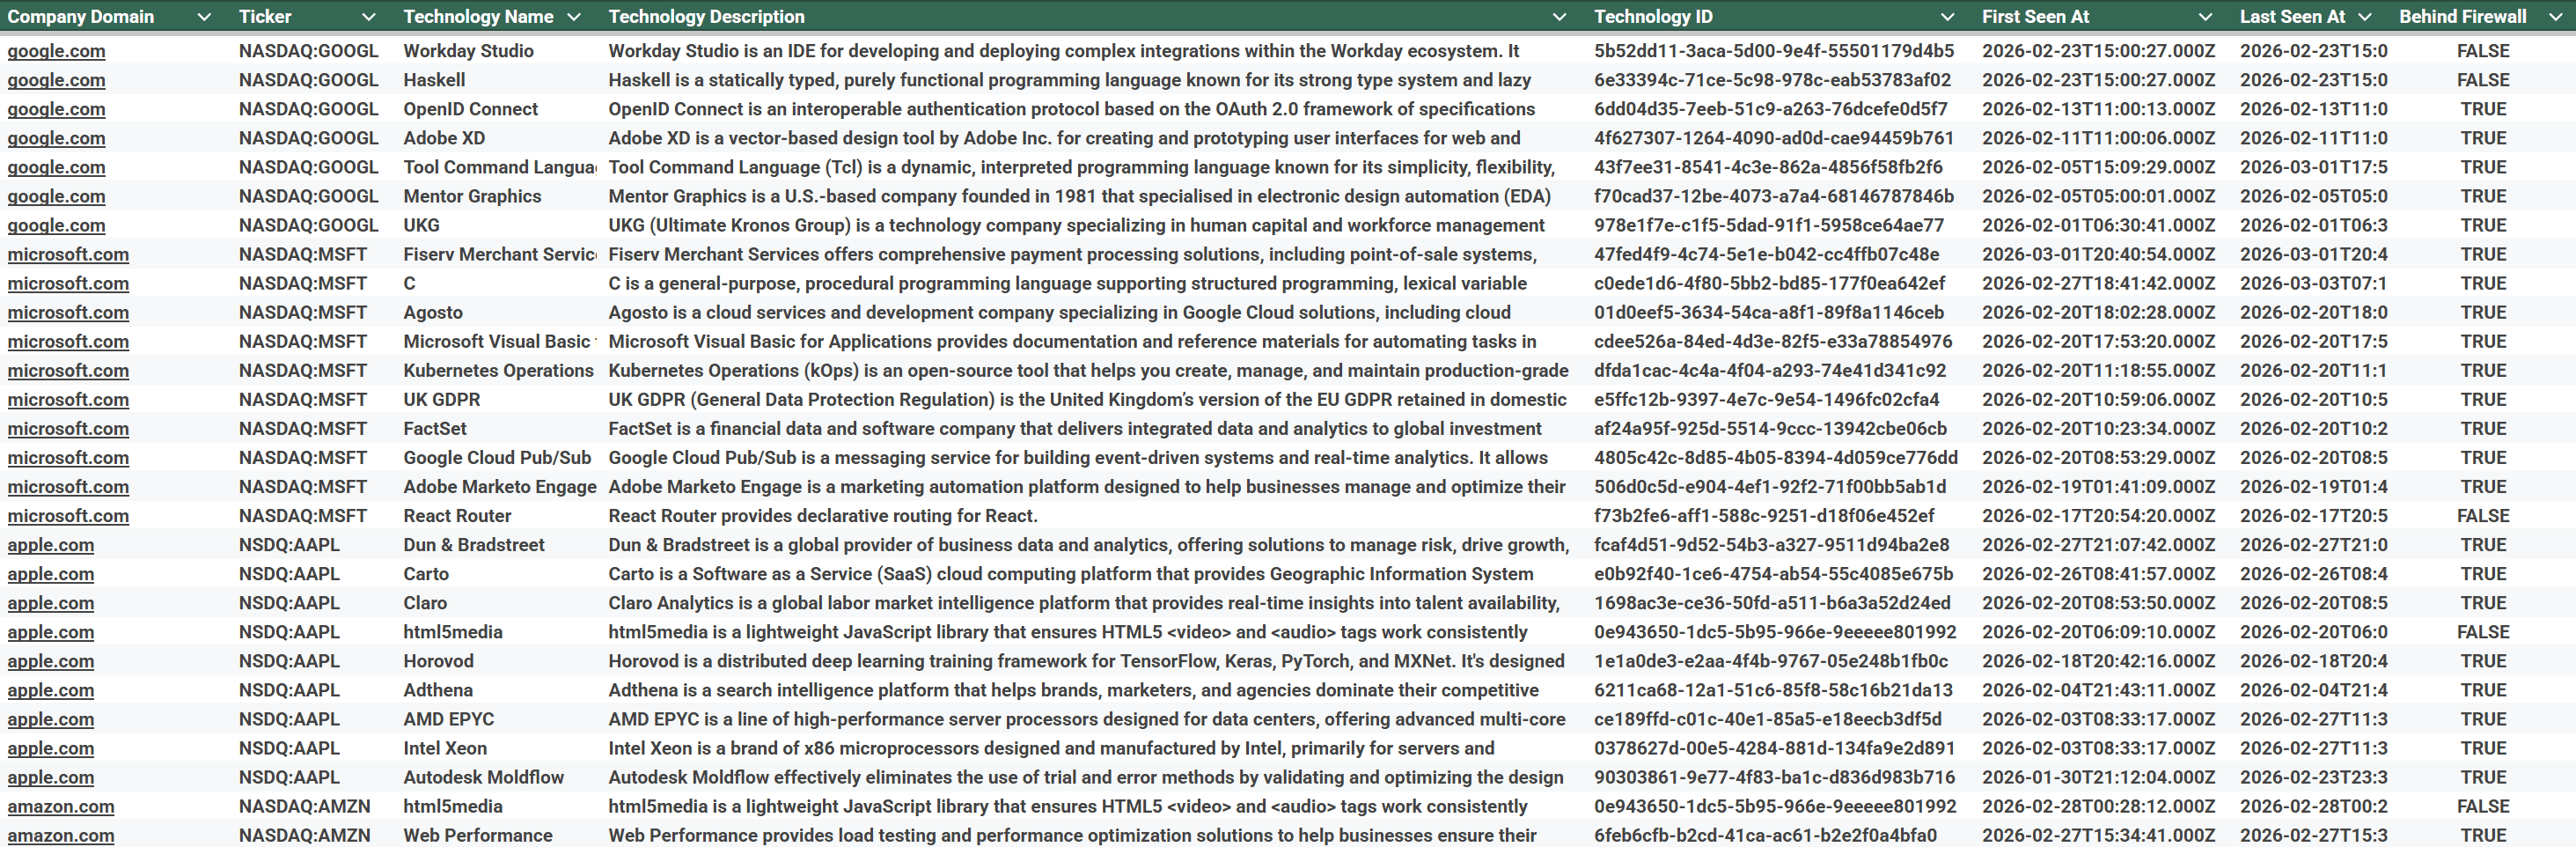
Adoção de tecnologia

* Medir o uso de uma stack de tecnologia moderna * Detectar mudanças recentes na stack de ferramentas

Cada sinal segue o mesmo padrão: Buscar → Filtrar → Agregar → Variável !Guest post_Predictleads_Table

学以致用,立即上手

读完文档后,不如亲自动手 — 免费注册 Make.com 账户,跟着教程搭建你的第一个工作流

✓ 永久免费版 ✓ 无需信用卡 ✓ 60 秒注册
🚀 免费注册 Make 账户